Following up on my "companion graph" post of 4 October.
The
blue line shows Debt-to-GDP, nonfinancial debt to gross domestic
product. The red line shows inflation as measured by the GDP Deflator:
 |
| Graph #1 |
The black box in the middle of the graph captures the years 1981-1986. In that box in blue we see the sudden increase in debt-to-GDP. At the same time, in red, we see the Volcker disinflation, 1981-1986, within that same black box. These changes happened at the same time.
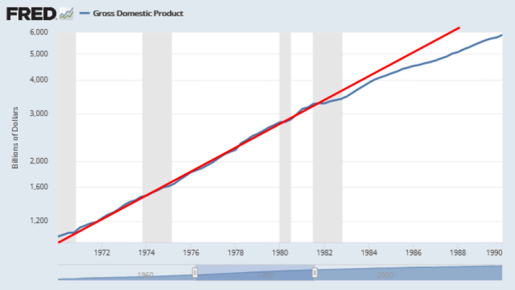
The dramatic fall of inflation created a dramatic slowing of nominal GDP growth:
 |
| Graph #2: Nominal GDP on a Log Scale, where a straight line indicates a constant rate of growth. GDP growth (blue) falls off after 1981. |
The dramatic slowing of GDP growth created a dramatic increase in the Debt-to-GDP ratio.


No comments:
Post a Comment