Sunday, October 28, 2018

...and finally, argument by unfounded assertion

It bothers a lot of people that food and energy are excluded from the inflation measure that is used by the Fed as a guide to policy.

It bothers Jayhawk:
So how did the “Trump tax cut” cause the decline in new home sales? Well, the tax cut caused runaway inflation, which we didn’t see but Dean Baker and the Federal Reserve did, when it soared to dizzying heights and got all the way up to 1.87% last year.

Never mind that the price of gasoline went up 74%, it’s all in how you measure things. Dean Baker and the Fed only measure the prices of things that people don’t buy. Food, energy and housing are not included, thus 1.87% inflation.
Yeah, it bothered me too. A lot. But I read something that rang a bell, and now it doesn't bother me at all. At least for now.

Randal K. Quarles:
Traditionally, as taught in Econ 101, inflation provides a signal on whether the economy is operating above or below its potential level. If inflation moves up in a sustained manner, not just because of temporary shocks, then the economy is likely operating above its productive capacity, as firms have the leeway to raise prices given the strength of demand.

Three things about that statement. First,
inflation provides a signal on whether the economy is operating above or below its potential
Yeah, okay, that's mainstream econ. The dumbed-down "Econ 101" version maybe, but mainstream. I have just one problem with it, which I'm saving for last.

Second,
If inflation moves up in a sustained manner, not just because of temporary shocks, then the economy is likely operating above its productive capacity...

Just the way Quarles said it, I get it: if inflation moves in a sustained manner, not because of temporary shocks. The Fed is looking for evidence of sustained inflation, not for evidence of brief disturbances. They're looking at the trend, not the jiggies. It makes good sense.

I think that's probably a good way to set policy. But I don't think it's a particularly good way to measure the inflation that affects us as consumers, or whatever we call ourselves. I'm still with Jayhawk on that. If the price of gasoline went up 74% because of some "shock", we still had to pay the higher price. The cost of living includes it all, you know? Even food and gasoline.

So I figured I'd make a graph comparing the PCE Price Index with, and without, those "shock" categories. And then it got interesting:

Graph #1: PCE Price Index including (red) and omitting (blue) Food and Energy Costs

Moving together in 2012 and 2013, the two datasets separated in 2014. And since that time, the one that includes food and energy has been lower. So, by this measure anyway, leaving out food and energy shocks makes the price index higher. I can't tell you why, but that's what the graph shows.

I need another look. A second graph. This time, showing the index that omits food and energy, relative to the index that includes them:

Graph #2: Excluding Food and Energy, relative to Including Food and Energy
If "shocks" to food and energy prices were pushing the rate of inflation up, then the index that doesn't count them would be lower than the one that does. But the index that doesn't count the shocks is higher, since 2014.

So the Fed is using the higher measure of inflation as a guide to policy. Not the lower measure. And you really cannot say what Jayhawk seems to imply, that they're excluding food and energy to reduce the calculated rate of inflation.


"...and finally, argument by unfounded assertion"

Getting back now to what Randal Quarles said, there is one more point I have to make.
If inflation moves up in a sustained manner, not just because of temporary shocks, then the economy is likely operating above its productive capacity, as firms have the leeway to raise prices given the strength of demand.
If there is a sustained increase in inflation, Quarles says, it is because of the strength of demand. In other words, all inflation is demand-pull.

Saturday, October 27, 2018

The purpose of prediction

The purpose of making prediction based on theory is that it is a test of the theory. I read this, somewhere. Anyway, it means that if events turn out as predicted, the theory is not rejected and may deserve increased attention.

Back in the Spring of 2016 I said the economy had hit bottom and things were picking up. I predicted vigor. I also said it would be a couple years before the vigor was noticeable, and that it would last for several years. My prediction was based on the theory that when financial cost in the economy is low but rising, growth is good; and when financial cost is high it consumes money that otherwise might have gone into growth.

Anyway, this morning I find Randall Quarles in a speech of 18 October 2018, saying:
... in February, I characterized the U.S. economy as being in a "good spot" and asked if the economy had reached a positive turning point following an extended period of post-crisis slow growth. I argued that while it might be too soon to call a turning point, there was a definite possibility of an upside surprise.

So now that we are fairly deep into 2018, where do we stand overall? My view has not changed all that much from February. While many other forecasters had to revise up their forecasts over the course of the year, my own outlook is basically unchanged, because the economy is evolving essentially as I expected at the outset of the year. The economy remains in a good spot...
The predicted improvement became noticeable to Randal Quarles early in 2018. Right on schedule.

Quarles also says
How long can this strong growth be sustained? ...

... I see many reasons to be optimistic about the growth of the potential capacity of the economy over the next few years. In part, my optimism is rooted in the view that many of the factors that have been weighing on potential growth since the financial crisis could be lifting. So, have we reached the turning point? While I believe the issue remains unresolved, the recent evidence is encouraging.
The strong growth will last as long as people are willing to expand their debt obligations.

// See also: my Vigor page.

Wednesday, October 24, 2018

How to reduce our trade deficit

Keynes, from Chapter 23:
If the domestic rate of interest falls so low that the volume of investment is sufficiently stimulated to raise employment to a level which breaks through some of the critical points at which the wage-unit rises, the increase in the domestic level of costs will begin to react unfavourably on the balance of foreign trade, so that the effort to increase the latter will have overreached and defeated itself.
Paraphrasing: If unemployment falls below the NAIRU, rising wages will create inflation. Rising prices will make domestic products less competitive on world markets, and will tend to push the balance of trade toward deficit.

In other words, trade deficits may be caused by high domestic costs.

You can accept this conclusion, or reject it. I accept it.

If you accept it, you can accept or reject the view that the rising wage is the only cause of high domestic costs. I reject it.

If you reject the view that the rising wage is the only cause of high domestic costs and the resulting trade imbalance, then you are free to consider other explanations.

In my view, the cost of a large and growing financial sector is the prime mover that raised domestic costs in the post-WWII period.


Your President thinks the trade imbalance is best reduced by tariffs on imports.

I think the trade imbalance would be best reduced by adding cash to the economy while reducing policy incentives to borrow and, at the same time, implementing policy incentives to repay debt. By driving the cost of finance out of products, we can reduce costs and make our products competitive on world markets again.

Tuesday, October 23, 2018

The last chapter

The first sentence:
The outstanding faults of the economic society in which we live are its failure to provide for full employment and its arbitrary and inequitable distribution of wealth and incomes.

Monday, October 22, 2018

One interesting economist


Recommended skimming: Modernizing Monetary Policy Rules by James Bullard.


"Interesting": Finding new ways to look at accepted ideas, resulting in new ideas. I'm thinking of Bullard's earthquake and his 2½-year forecast horizon in addition to the "modernizing" piece.


// Two brief thoughts on Bullard's Modernizing:

1. People look for all sorts of ways to get the inflation number down. Not necessarily to get inflation down, but to get the number down. Bullard subtracts three tenths of a point from the CPI inflation rate, because CPI inflation is higher than PCE inflation.

Is it a reasonable adjustment? Maybe. Probably. But it is just another way to bring the inflation number down.

2. Bullard says
the general level of short-term real interest rates has been trending lower for three decades
He does not talk about why rates have been falling for an extended period. He just goes with the fact, and makes use of it in his calculations.

Granted, the reasons that rates have been falling are not relevant to his topic. I'm just saying he shouldn't have moved on to this topic until the reasons rates have been falling have been thoughtfully and thoroughly examined.

So now of course I will have to search through his works, looking for his thoughts on the reasons rates have been trending lower for three decades. Not today. But I'm thinking that when I do, I'll find Bullard generally accepting the view of John C. Williams and others, that demographics is the main reason for the long-term decline in rates.

The path of interest rates has not been thoughtfully and thoroughly examined unless the discussion includes debt, private debt, its effects on the economy, and the unintended consequences of policy which created such high levels of debt.

Sunday, October 21, 2018

Surprised me

From Robert T. McGee's Applied Financial Macroeconomics and Investment Strategy, pages 36 and 37:
As mentioned in chapter 1, over long periods of time job growth seems to depend mainly on how many people are available to work, that is, the growth of the labor force. That's because the trend growth rate of the economy is determined by the labor-supply growth rate and the growth in its productivity. Interestingly, low labor-force growth seems to put pressure for stronger productivity growth. This seems to have been the case in the 1950s, when the low-birth cohort from the Great Depression came of age to work. Despite a slow-growing workforce, productivity was higher, and the economy grew at a respectable rate. Conversely, when the huge babyboom generation was coming of age in the 1970s, productivity growth dropped significantly, suggesting cheaper, abundant labor was substituted for relatively more dear capital.

Reminds me of what Menzie Chinn said (January 2017) about Donald Trump's 3½-to-4% growth target:
In order to hit the lower bound of the Trump target for 2017-2020, either contributions from labor force growth, or labor productivity, or combination thereof, must accelerate by 1.8 percentage points.
An increase in output requires either an increase in hours worked or an increase in output per hour, or both. Chinn called this "growth accounting". Here's the graph he showed:


Okay, so Chinn and McGee agree on the growth accounting. But that's not why I'm quoting McGee. I'm quoting McGee because he says low labor-force growth seems to create pressure for stronger productivity growth. He says it's interesting, and I agree; but I think he means to suggest it is surprising. I certainly found it surprising.


I accessed the FRED index series Nonfarm Business Sector: Real Output Per Hour of All Persons, changed it from quarterly to annual data, and imported it into Excel. Figured "percent change from year ago" values, and took averages for time periods to match the graph Chinn showed. Except I stopped at 2017, the last year for which I had data.

Then I got the FRED series Civilian Labor Force and set it up the same way. I put the two together on a graph, and copied the 2017 value out to 2027 so my graph ends when Chinn's graph ends.

Do productivity growth and labor force growth tend to move in opposite directions?


Well, yes they do. Except during the special circumstances of 2007-2008, all of the changes are in opposite directions.

They do move in opposite directions. From the annual data, I would never have guessed:


Friday, October 19, 2018

I've been looking at this all wrong

Not: Interest Paid relative to GDP...
But: Interest Paid relative to the money we use to pay for things.

Graph #1

Monday, October 15, 2018

Nobody saw it coming

The event was supposed to be a celebration of academic achievement, but the timing was poignant. Two months earlier, the financial crisis had erupted in London and many other parts of the West, leaving hordes of economists and pundits scurrying to provide analysis. As the Queen toured the build­ing, Luis Garicano, one highly regarded economist, pre­sented her with some charts that purported to show what was going on in finance.

The Queen peered at the brightly colored lines. “It’s awful!” she declared, in her clipped, upper-­class vowels. “Why did nobody see the crisis coming?”


From This Week with George Stephanopoulos, 14 October 2018. From the discussion with Larry Kudlow. From the rush transcript:
STEPHANOPOULOS: Do you believe the Fed is out of control?

KUDLOW: I do want to add, however, quickly -- look, I don’t, personally, and the president respects the independence of the Fed. Let me make that very clear. He said as much during these comments. He is not telling them or mandating them to change their strategy, he’s not telling them to change their policy, he’s just raising a very important issue. Which, by the way, everybody else in the world is also raising. I do think -- want to say this -- pretty much everybody believes that we want this economic boom, which virtually no one expected, we want this boom to continue.
...this economic boom, which virtually no one expected...

Sunday, October 14, 2018

Say's Intermittent Law

From Applied Financial Macroeconomics and Investment Strategy by Robert T. McGee, pages 37 and 38:
Still, an upswing in the business cycle tends to build on itself, partly because a growing labor force that is finding jobs creates new incomes that increase demand for new goods and services, sparking a virtuous circle of rising jobs and incomes. This is the dynamic behind Say's Law, which as noted earlier, refers to the notion that supply creates its own demand. This dynamic works as long as the economy expands. Keynes' contribution was to highlight the need to support demand when confidence is low and this dynamic starts working in reverse. Say's Law seems to be asymmetric, working in good times and breaking down in bad (deflationary) times.

Saturday, October 13, 2018

You never know

FRED Blog looks at the yield curve (11 Oct) and says:
This FRED graph effectively illustrates that every recession since 1957 has been preceded by a yield curve inversion...

In December 2013, the spread between long and short rates was very close to 3 percent. In September 2018, the spread was 0.44 percent for the 10-year and 1-year yields and 0.87 percent for the 10-year and 3-month yields. If the yield curve were to continue its downward trend from its previous high in December 2013, the yield curve would invert in August 2019 (using the 10-year and 1-year yields). Historically, this would predict a recession sometime in 2020.
Here's the graph from the FRED Blog:


Below, the same monthly data, red and blue, only since January 2017. Plus, I added the daily data, purple and green, for the same interest rates.


Both dailies show increase since the end of August. Even the monthlies have gone flat.

Yes, for sure, the dailies run uphill and down. And yes, it looks like the dailies may now be ready to go down for a month. But nobody knows. Maybe they're taking a breather, and they're gonna go up for another month or six.

One other thing. On the first graph you can see that the yield spread went below 1% in 1995 and stayed pretty darn low for 5 or 6 years before the recession hit.

You know what else happened for those 5 or 6 years? The economy was pretty darn good.

Thursday, October 11, 2018

Go, Dean Baker. Go!

Thoma links to Dean Baker. Baker quotes Mankiw:
"Nations run trade deficits when their spending on consumption and investment, both private and public, exceeds the value of goods and services they produce. If you really want to reduce a trade deficit, the way to do it is to bring down spending relative to production, not to demonize trading partners around the world."
and responds:
Without saying it, Mankiw has slipped in the assumption that the economy is already operating at its potential level of output so that a smaller trade deficit cannot boost output.

He's right, Baker. Potential Output is a supply-side measure. It's an estimate of how much we can produce, not of how much we can consume. Mankiw assumes we cannot bring production up relative to spending -- i.e., we are operating at potential -- and so says "the way to do it is to bring down spending relative to production".

I think this is a really brilliant observation by Dean Baker.

Wednesday, October 10, 2018

Tuesday, October 9, 2018

The prediction I've been waiting for

Arthurian, March 3, 2016:
This is not going to be your typical anemic recovery. This is going to be the full tilt, rapid output growth, rapid productivity growth, high performance boom.

I can't promise you it'll last long, because the level of debt is already very high. But it'll be a good one while it lasts.

Arthurian, April 7 2016:
I predict a boom of "golden age" vigor, beginning in 2016 and lasting eight to ten years. It has already begun. In two years everyone will be predicting it.


Quartz, October 5, 2018:
Earlier this week, the central bank’s chairman Jerome Powell said the economy was looking “remarkably positive” (paywall) and that the US could be on the verge on an “historically rare” era of ultra-low unemployment and steady inflation. “There’s no reason to think this cycle can’t continue for quite some time, effectively indefinitely,” Powell said.


The Chairman of the Federal Reserve is now predicting the economy that I have been predicting since 2016. Okay, so it took two years and a half.

How did I know? I watch the ratio of TCMDO debt to M1SL Money -- the bills we have to pay, relative to the money we use to pay them.

Monday, October 8, 2018

GVA Finance

GVA Corporate Finance, actually. GVA Finance would have to include noncorporate financial business, which would make the number bigger. But three extra syllables weigh me down and slow me down.

Can't have that. I'm slow enough as is, at top speed.


Remember the "output gap"? It looked like this:

Graph #1 Source: Mother Jones, 16 March 2012
If you still don't remember, go read Kevin Drum.

Anyhow, I just now found a similar-looking gap in Finance: in GVA Corporate Finance.

Remember when it used to be "FI!-nance"? Then a commercial came on TV and changed it to "fuh-NANCE!". A softer, gentler name, to make us love finance. Screw that. They don't need our love. They have our money.

And you thought the government had your money, you silly boy.

Graph #2: GVA Finance Falls Behind Trend after 2006
I see a straight-line trend of increase since the end of the second World War. Sudden drop there, just before the 2009 recession. And after that, GVA Finance runs below trend, showing a gap that looks a lot like the output gap.

Couple things are different, though. Since 2009, GVA Finance has climbed back up toward trend. Yes, real GDP has also moved closer to trend, but that is because they kept moving the "trend line" down to bring it closer to actual GDP.

Yeah, they did:

Graph #3 Source: Center on Budget and Policy Priorities, 31 Jan 2018
It would be like taking the dashed line on Graph #2 and tipping it down to bring it closer to the actual numbers. And no, you wouldn't call that "cheating". You'd just call it a "revision". Winston Smith could tell you all about it.

But there is something else about the trend of GVA Finance. As Bezemer & Hudson put it:
National accounts have been recast since the 1980s to present the financial and real estate sectors as “productive”.
"National accounts have been recast". That must be a good portion of what the "revisions" have been about. And then the "base year" is changed, too, which makes it more difficult to compare the new and old data to see how much GDP went up due to the recasting.

I quote now from The Financialization of GDP: Implications for Economic Theory and Policy by Jacob Assa. From the Foreword by Brett Christophers:
The idea that contemporary capitalism represents a form of financialized capitalism is problematic, Assa maintains, because the statistical measure most commonly employed to demonstrate such financialization -- gross domestic product, of which finance is estimated to have accounted for an increasing proportional quantum -- has itself been financialized. Hence: "the financialization of GDP."

But what does Assa mean by this? What he means is that the way in which GDP is calculated has been changed in recent decades in such a way as to boost the relative contribution to GDP that the financial sector is seen to make, regardless of any actual transformation in the underlying economy...

His most distinctive contribution in this book ... is to at once recognize the problematic nature of the existing statistical framing and to suggest an alternative approach to GDP measurement...

Assa's preferred metric -- final GDP (FGDP) -- treats financial activities not as a positive economic output ... but instead as an intermediate input -- and thus as a net cost to the wider economy.
Yes! And thank God someone has finally said it. Finance is a cost. But those damn revisions take more and more of the bits and pieces of finance and choose to see them not as something that subtracts from GDP, but as something that adds to it.

It pushes GDP up. It pushes finance up. And according to Jacob Assa and Brett Christophers, and Dirk Bezemer and Michael Hudson, it is one of the reasons that finance has grown as a share of GDP: One of the reasons the line goes up on Graph #2.

And then, there is another difference: Graphs of the output gap compare a tally to its trend. My graph of the GVA Finance gap compares a ratio to its trend.

Only two things can change the output gap: changes in GDP, or fiddling with the trend. But three things can change the GVA Finance gap: changes in finance, changes in GDP, or fiddling with the trend.

GDP didn't go up relative to trend until they fiddled with the trend. Finance has been going up relative to GDP, because they fiddled with the actual values.


I'm not sure what-all they count as "finance". I know it gets revised too often, but what they include I couldn't say. But I know what I see as the main cost of finance: the cost of interest. Not the rate of interest, but the amount we pay in dollars to service the interest we owe. FRED has a data series for that, called "Monetary Interest Paid". I put it on a graph along with "Gross value added of financial corporate business" in billions:

Graph #4
Red is interest paid; blue is GVA of Financial Corporations, in Billions. After 1970 or so it is easy to see that GVA is a good chunk of interest paid. How big a chunk?

Graph #5: GVA Finance as a Percent of Monetary Interest Paid
GVA Finance was near 38% of Interest Paid in 1960. It fell below 16% in 1981. And it has been generally showing increase since then, reaching above 54% in 2015. If you just look at it as "downtrend to 1981 and uptrend since" it runs opposite interest rates.

Turn that ratio upside-down, and it tends to follow interest rates:

Graph #6: Showing the Similarity of Interest Rates and Interest Paid relative to GVA Finance
It is too similar not to point out. But what does it mean? As Riggs said to Murtaugh, probably nothing.

Or idunno, you tell me.

Sunday, October 7, 2018

"Keynesianism + the theory of growth = The New Economics"

Some quotes:

How soon will normal business enterprise come to the rescue? What measures can be taken to hasten the return of normal enterprise? On what scale, by which expedients and for how long is abnormal government expenditure advisable in the meantime?


"What Keynes called for was deficits when the private sector cut back", Kimel says in a comment at Presimetrics, "and surpluses at other times".


Today, some 20 years after his death, his theories are a prime influence on the world's free economies, especially on America's, the richest and most expansionist. In Washington the men who formulate the nation's economic policies have used Keynesian principles not only to avoid the violent cycles of prewar days but to produce a phenomenal economic growth and to achieve remarkably stable prices. In 1965 they skillfully applied Keynes's ideas—together with a number of their own invention—to lift the nation through the fifth, and best, consecutive year of the most sizable, prolonged and widely distributed prosperity in history.

Though Keynes is the figure who looms largest in these recent changes, modern-day economists have naturally expanded and added to his theories, giving birth to a form of neo-Keynesianism. Because he was a creature of his times, Keynes was primarily interested in pulling a Depression-ridden world up to some form of prosperity and stability; today's economists are more concerned about making an already prospering economy grow still further. As Keynes might have put it: Keynesianism + the theory of growth = The New Economics.

Keynesianism made its biggest breakthrough under John Kennedy, who, as Arthur Schlesinger reports in A Thousand Days, "was unquestionably the first Keynesian President." Kennedy's economists, led by Chief Economic Adviser Walter Heller, presided over the birth of the New Economics as a practical policy and set out to add a new dimension to Keynesianism. They began to use Keynes's theories as a basis not only for correcting the 1960 recession, which prematurely arrived only two years after the 1957-58 recession, but also to spur an expanding economy to still faster growth.


See also: Moments in Time

Saturday, October 6, 2018

Demand Deposits relative to Total Credit Market Debt

Demand deposits, that's the money we spend when we're not using credit cards. Basically. Except for the greenbacks in your pocket.


"Demand Deposits" is the money we use when we pay the bills. "Total Credit Market Debt", that's the bills we have to pay.

Friday, October 5, 2018

Menzie shows some graphs

Here.

Including these two:

Figure 4: Household debt rose in crisis countries

Figure 5: But not in non-crisis countries

Figures 4 and 5, with Menzie's captions.

Thursday, October 4, 2018

"Consensus Assignment"

Begin with an observation by Simon Wren-Lewis:
[The] consensus assignment [1] is that interest rates should be used to stabilise the economy rather than fiscal policy. The whole idea of independent central banks setting interest rates is predicated on this assignment.
Use interest rates to stabilize the economy, and fiscal policy for other things: This is the Consensus Assignment. Then, a powerful thought: "The whole idea of independent central banks setting interest rates is predicated on this assignment."

Simon's footnote reads
[1] The term assignment comes from the idea that you have two instruments that can control inflation, fiscal policy or interest rates, and an assignment is where only one instrument is used to do the job. You could use both, of course, but if each instrument is controlled by different people with different views about the economy obvious problems could arise. Also in simple New Keynesian models it is optimal just to use monetary policy. I use the term conventional or consensus because it is the assignment that pretty well all advanced countries use, and the one most mainstream academic macroeconomists would recommend.
Pretty well all advanced countries use interest rates to stabilize the economy, and fiscal policy for other things.

In an older post Wren-Lewis says
Inflation targeting by central banks involves an attempt to manage the economy in much the same way as Keynesian fiscal activism had done before.
That sentence shines light on a change in the "consensus assignment" and gives me a better feel for what the term means. In that post also, Wren-Lewis describes the consensus assignment as "monetary to demand management, fiscal to debt control".

As Simon puts it, we rely on central banks to "stabilize the economy" or "manage" demand. But you can't push on a string. So the management is one-sided: It can reduce growth, but it cannot increase growth. (It can allow growth to increase, but cannot force growth to increase.) So you really don't have "management" of demand. All you have is attenuation:

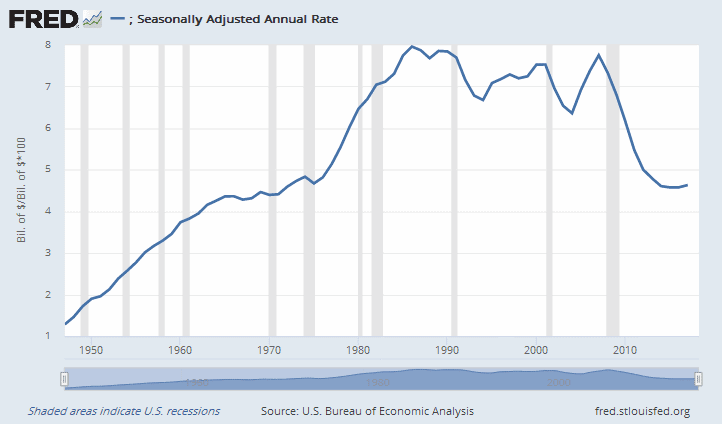
Attenuation of Demand since the 1980s
The high points on the graph are generally lower after 1983 than before. That's attenuation.

Also, the lows are generally higher after 1983. This probably means that the growth that was cut off the top came back later to fill in the lows at the bottom. Demand was postponed from a time of high growth to a time of low growth. That's pretty interesting. It could account for the reduced volatility described by the words "the great moderation".

That seems right. Average growth during the Great Moderation was a little lower than in the years before. You would expect average growth to be a little lower, if your method of management is to postpone growth.

I would say that the higher lows since the 1980s were not so much policy as the economy's response when "demand management" relented in its battle against inflation. As the 2009 recession shows, however, attenuating the highs does not give you control over the lows. You can allow growth to increase, but you cannot force it. You can't push on a string.

By the way, Wren-Lewis is not defending the "monetary to demand management, fiscal to debt control" consensus assignment. He says it's dead. If so, we probably need a new match-up of policy instruments and economic objectives.


In his "Consensus Assignment is dead" post, Wren-Lewis quotes Martin Sandbu:
Besides, there was broadly shared understanding among macroeconomists and central bankers of the best division of labour. Fiscal and budgetary policy should be set to achieve microeconomic and distributive goals, and the desired share of the state in the economy; while monetary policy should take care of stabilising aggregate demand.
Division of labor. Wren-Lewis replies:
This is what I call the Consensus Assignment, and as the name implies it was certainly the consensus among mainstream macroeconomists before the 1990s. But the experience of Japan’s lost decade where they also had interest rates stuck at the ELB began a process of rethinking. By the time the GFC came around many macroeconomists had realised that there was an Achilles Heel in the Consensus Assignment. Fiscal stabilisation was still required when interest rates hit their ELB. That is why we had fiscal stimulus in 2009.
Here again we find monetary policy attenuating demand. Fiscal, Sandbu says, is used to manage the shape and the size of the economy. Wren-Lewis reduces this to a single sore point: "fiscal to debt control". I would say "fiscal to economic growth" -- to the shape and size of the economy.

Similarly, I would reduce "monetary to demand management" to "monetary to inflation control".


From JW Mason:
An increasingly visible school of heterodox macroeconomics, Modern Monetary Theory (MMT), makes the case for functional finance—the view that governments should set their fiscal position at whatever level is consistent with price stability and full employment, regardless of current debt or deficits.
Fiscal to inflation control, monetary to debt control. The opposite of the consensus assignment described by Simon Wren-Lewis. Mason continues:
Functional finance is widely understood, by both supporters and opponents, as a departure from orthodox macroeconomics. We argue that this perception is mistaken: While MMT’s policy proposals are unorthodox, the analysis underlying them is largely orthodox. A central bank able to control domestic interest rates is a sufficient condition to allow a government to freely pursue countercyclical fiscal policy with no danger of a runaway increase in the debt ratio.
Central banks using interest rates for debt control: again, the opposite of the assignment described by Wren-Lewis.

Mason continues:
The difference between MMT and orthodox policy can be thought of as a different assignment of the two instruments of fiscal position and interest rate to the two targets of price stability and debt stability.
Mason describes it as a different assignment of the two instruments to the two targets. Here he is using Wren-Lewis's "consensus assignment" concept and terminology as a framework to describe the way economic policy is used.

That is fascinating, I think. And useful: It helps me see the assignments as assignments rather than as economic laws. Simon points out that the consensus assignments are widely accepted by policy economists in "pretty well all advanced countries" and by "most mainstream academic macroeconomists". That may make changing the assignments difficult. But it doesn't make them laws.


From me, from a long time ago, my own view of what the assignments are and the problem with that arrangement:

Government has two tools to make an economy work: monetary policy, and fiscal policy...
Where I use the word "tools" Simon Wren-Lewis says "instruments". Two tools of policy, I say. Two instruments of policy, he says. But we do agree on what those tools (or instruments) are.

The rest of that thought is all mine:
Government has two tools to make an economy work: monetary policy, and fiscal policy. But our national policy decisions combine these policies badly. Monetary policy has been at odds with fiscal policy since the end of World War II.

The problems in our economy today are a result of our conflicting policies. In order to repair our economy, it will be necessary to make the policies cooperate. If you know how the policies work and how they conflict, then you will know what must be done.

Fiscal policy is often called "tax and spend" policy. We think of it as something that the government wants more of, while we want less. But there is more to it than that. Taxes are used in many ways to encourage economic growth. Tax policy encourages business spending in order to boost economic activity and boost incomes. Fiscal policy is a highly effective way to stimulate the economy.
Fiscal to economic growth.
Monetary policy takes money out of circulation in an attempt to reduce inflation...
Monetary to inflation control.

Takes money out of circulation... Or raises interest rates to reduce the growth of borrowing and reduce the pace at which bank money is being added to the economy. Say it however you want. It still comes down to reducing the growth of the quantity of money. It still comes down to taking money out of circulation.
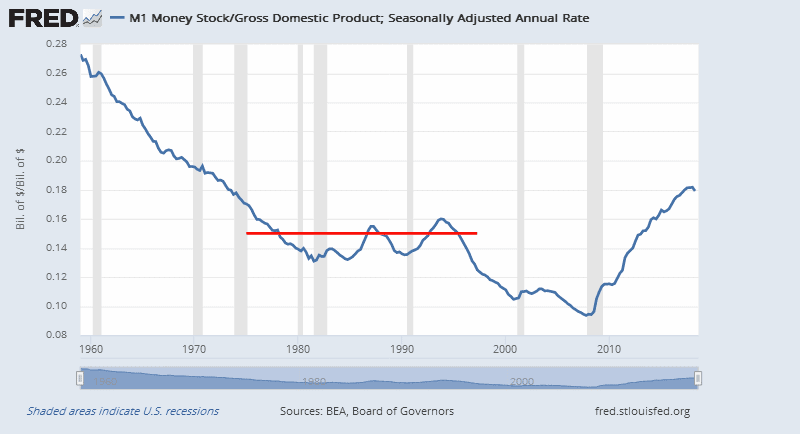
Monetary policy takes money out of circulation in an attempt to reduce inflation. While our economy has grown over the last half century, the money supply has dwindled from 50 cents to 15 cents per dollar's worth of output. That decrease is the result of the monetary policy actions against inflation. We have created a nation of customers without money.
The quantity of money hung in the neighborhood of 15 cents (per dollar of output) from the mid-70s to the mid-90s. I could have written those words at any time during those years. (I did.)

Since the mid-90s the quantity of M1 money continued to dwindle, falling below ten cents per dollar of output shortly before the GFC, no doubt contributing to it.

Since 2008 the ratio has been rising. To restore the economy, the central bank reversed the trend. It is now above 16 cents. But it is not enough: We still have too much debt, public and private. We need less debt and more money per dollar of GDP.

Note that increasing the quantity of government money is not inflationary if we compensate by reducing the quantity of money created by private lending. In other words, "less debt" is a way to fight inflation.

Monetary policy can only achieve less debt by raising interest rates, so that new additions to borrowing are reduced. But that means new additions to GDP are also reduced: Raising interest rates is bad for growth.

Why not change the assignments, and use fiscal policy to fight inflation? We can establish variable tax rates that encourage the repayment of debt (so you can reduce your taxes by making extra payments on your debt). This approach gives us "less debt" by reducing existing debt. The central bank can keep interest rates low to encourage borrowing, to encourage economic growth. We can grow the economy and fight inflation at the same time, up to the point of full employment of resources.

Fiscal to inflation control. Monetary to economic growth.
On the one hand, monetary policy takes money out of circulation in order to limit spending. On the other hand, tax policy does everything possible to make our spending grow. As a direct result of these policies, we have less money but our spending has increased anyway. We have made up the difference by increasing our use of credit. And that has produced a tremendous accumulation of debt.

My evaluation of the conventional assignments:
  • Fiscal to economic growth
  • Monetary to inflation control
My evaluation is essentially the same as that of Simon Wren-Lewis, Martin Sandbu, and JW Mason.

Sandbu offers it as the current state. Wren-Lewis says no-no, that consensus is now dead (though this, it seems to me, is largely wishful thinking). Mason and Jayadev offer it as the orthodox consensus; they compare and contrast it with a heterodox view. I propose a reversal of the assigments, because our policies as they stand undermine each other.

Wednesday, October 3, 2018

The cost of finance is the extra cost

The cost of finance is the problem. That was my conclusion in yesterday's post. Naked assertion. So today we take a shot at documenting it. Let's look at the total cost of interest paid by households, as a percent of disposable income:

Graph #1: Monetary interest paid: Households/Disposable Personal Income*100
Yeah, don't mind the title of the graph. FRED was having a bad day. I yelled at em.

One percent of disposable income in the late 1940s. One, one and a half percent. But there was straight-line increase to the mid-60s,  followed by a much slower increase. Households already knew, then, that their debt was growing too fast.

But it wasn't that the number was getting big. It was that the cost was rising.

In the 1970s, interest rates went up a lot. The Fed was fighting inflation. Interest cost as a percent of disposable income topped out in the mid-1980s, and started slowly wandering downward. The 1991 and 2001 recessions speeded things up a bit, and the "great" recession speeded things up a lot.

It looks now like it's on the rise again.

//

The cost of interest depends on two things: It depends on the rate of interest, and on the amount of debt we pay interest on. Suppose we take out the rate of interest, and look at what remains.

I'm gonna guess that the average term of a loan is ten years. It's just a guess. Could be less. No matter.

I'll take the ratio shown on the first graph and divide it by a ten-year government interest rate. There are a million different interest rates we could use; I'm using this one. Here's what I get:

Graph #2: (Monetary interest paid: Households/Disposable Personal Income*100)/Long-Term Government Bond Yields: 10-year: Main (Including Benchmark) for the United States
Straight-line increase after 1981.

Look again? Down from 1963 to 1981. Up from 1981 to 2012. Possibly down after 2012, and possibly up before 1963.

Up from 1981 to 2012, reaching five, almost six times the 1981 level. Do we really need this much debt? Is the economy five or six times better now than it was in 1981? Has there been constant improvement, jiggy but constant, since 1981? I don't think so.

//

The cost of finance is like the cost of labor: It is one of the costs that contribute to the total cost of a product. The cost of finance is like the cost of productive capital that way also, except finance is not productive. It facilitates, yes, but it does not produce. But we don't need finance to do so much facilitation. We should have more government money doing more facilitation, so we would need less finance. The way things used to be.

If we cut back on finance, we can expand government money without expanding total money and without causing inflation. It would be easy, if we would do it. And by doing it, we can reduce financial cost to a practical minimum. Less debt, buddy. You love the idea.

Here's the thing. We don't need as much finance as we have. Most of finance, my guess, exists to put extra income in the pockets of the super-wealthy. A good part of it, anyway. Rent, some people call it.

We don't need as much finance as we have. We need more cash (or debit cards, if you prefer) and we need less money on which we pay interest. Maybe you think there is some problem to do that. There is no problem to do that. You just need the people in Congress and the Fed to understand the cost problem created by finance. What they see presently is the other side of that problem, the income generated by finance for themselves and their fat friends.

And I have to say no, the Democrats are no closer to understanding the cost problem than are Republicans.

Tuesday, October 2, 2018

"Prices" versus "Inflation"

Our objectives conflict. We want more growth, but not more inflation. However, when growth goes up, prices go up too. And when growth goes down, prices go down. Or at least that's how it used to work.

These days it's more like this: When growth goes up, inflation goes up; and when growth goes down, inflation goes down. This is not really the same thing, but that doesn't seem to bother anyone.

It should. It should bother you. It is a fundamental change in the way the economy works. But economists and commentators just use the word "inflation" now in place of the word "prices", and proceed as if nothing had changed.

Maybe we should try to figure out why that change occurred. Maybe that would help us understand the economic problem.

//

Here, I'll give you a hint. Instead of going up and down, prices go up more and go up less, but always go up. HINT: There is more cost now, more than there was when prices went up and down. There is more cost now.

What is that cost?

//

Here, I'll give you another hint: The cost of finance.