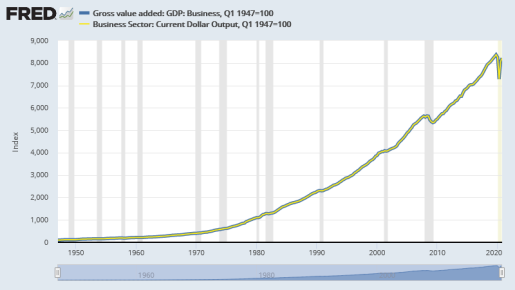
I just discovered that the "current dollar output" of the business sector follows the same path as "gross value added" of "GDP: Business":
 |
| Graph #1: Current Dollar Output (yellow) centered on GVA Business |
To see that they follow the same path, I indexed both series to the same date.
Here's
the thing: the GVA series is given in billions of dollars. The
Output series is given as indexed data, so you don't know how many
billions it is. But now I can convert the Output series to billions, or
just use the GVA series instead.

"Price per unit of Real GVA" as a measure of inflation
 |
| Graph #2: Comparing Unit Price of Real GVA to the GDP Deflator |
To my eye they look quite similar. Let me zoom in on the 1950-1962 period:
 |
| Graph #3: Comparing Unit Price of Real GVA to the GDP Deflator, 1950-1962 |
This graph is for comparison to the inflation graph in mine of 13 April. Here, the "percent change from year ago" in price-per-unit (blue) runs at zero from 1954:Q4 to 1955:Q2, then rises to 3.03% by 1956:Q1. It runs high until 1957:Q2, then starts to fall.
As noted on the 13th, this inflation was driven by the cost pressure created by falling labor productivity that was caused by the rapidly rising labor force participation rate of 1955. And maybe the graph also provides evidence that high interest rates can bring down even cost-push inflation.
High interest rates,
however, do not solve the cost problem that is the proximate cause
of the proximate cause of cost-push inflation -- if you get my drift. Fortunately, the rapid increase of labor force participation was only a one-year event.

I also found a "Profit per unit of real GVA" series at FRED. Taking that profit as a percent of "Price per unit of real GVA" generates this distinctive pattern:
 |
| Graph #4: Profit-per-Unit as percent of Price-per-Unit of Real GVA of NCB |
The
malaise of the 1970s is clearly visible after the fall from high (above
10%) profits to low (below 10%) profits in the latter 1960s. One decade of
low profits was more than enough to change mainstream economic thought. Since
Reagan, the highs have gone higher and, since 2000, even the laws that
govern the functioning of the economy appear to have been altered by policy.
I don't know how else to describe it.


No comments:
Post a Comment