Can't have that. I'm slow enough as is, at top speed.

Remember the "output gap"? It looked like this:
 |
| Graph #1 Source: Mother Jones, 16 March 2012 |
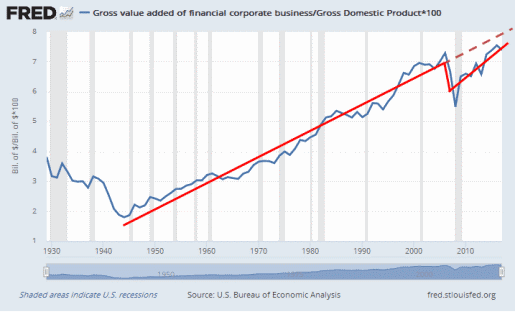
Anyhow, I just now found a similar-looking gap in Finance: in GVA Corporate Finance.
Remember when it used to be "FI!-nance"? Then a commercial came on TV and changed it to "fuh-NANCE!". A softer, gentler name, to make us love finance. Screw that. They don't need our love. They have our money.
And you thought the government had your money, you silly boy.
 |
| Graph #2: GVA Finance Falls Behind Trend after 2006 |
Couple things are different, though. Since 2009, GVA Finance has climbed back up toward trend. Yes, real GDP has also moved closer to trend, but that is because they kept moving the "trend line" down to bring it closer to actual GDP.
Yeah, they did:
 |
| Graph #3 Source: Center on Budget and Policy Priorities, 31 Jan 2018 |
But there is something else about the trend of GVA Finance. As Bezemer & Hudson put it:
National accounts have been recast since the 1980s to present the financial and real estate sectors as “productive”."National accounts have been recast". That must be a good portion of what the "revisions" have been about. And then the "base year" is changed, too, which makes it more difficult to compare the new and old data to see how much GDP went up due to the recasting.
I quote now from The Financialization of GDP: Implications for Economic Theory and Policy by Jacob Assa. From the Foreword by Brett Christophers:
The idea that contemporary capitalism represents a form of financialized capitalism is problematic, Assa maintains, because the statistical measure most commonly employed to demonstrate such financialization -- gross domestic product, of which finance is estimated to have accounted for an increasing proportional quantum -- has itself been financialized. Hence: "the financialization of GDP."Yes! And thank God someone has finally said it. Finance is a cost. But those damn revisions take more and more of the bits and pieces of finance and choose to see them not as something that subtracts from GDP, but as something that adds to it.
But what does Assa mean by this? What he means is that the way in which GDP is calculated has been changed in recent decades in such a way as to boost the relative contribution to GDP that the financial sector is seen to make, regardless of any actual transformation in the underlying economy...
His most distinctive contribution in this book ... is to at once recognize the problematic nature of the existing statistical framing and to suggest an alternative approach to GDP measurement...
Assa's preferred metric -- final GDP (FGDP) -- treats financial activities not as a positive economic output ... but instead as an intermediate input -- and thus as a net cost to the wider economy.
It pushes GDP up. It pushes finance up. And according to Jacob Assa and Brett Christophers, and Dirk Bezemer and Michael Hudson, it is one of the reasons that finance has grown as a share of GDP: One of the reasons the line goes up on Graph #2.
And then, there is another difference: Graphs of the output gap compare a tally to its trend. My graph of the GVA Finance gap compares a ratio to its trend.
Only two things can change the output gap: changes in GDP, or fiddling with the trend. But three things can change the GVA Finance gap: changes in finance, changes in GDP, or fiddling with the trend.
GDP didn't go up relative to trend until they fiddled with the trend. Finance has been going up relative to GDP, because they fiddled with the actual values.

I'm not sure what-all they count as "finance". I know it gets revised too often, but what they include I couldn't say. But I know what I see as the main cost of finance: the cost of interest. Not the rate of interest, but the amount we pay in dollars to service the interest we owe. FRED has a data series for that, called "Monetary Interest Paid". I put it on a graph along with "Gross value added of financial corporate business" in billions:
 |
| Graph #4 |
 |
| Graph #5: GVA Finance as a Percent of Monetary Interest Paid |
Turn that ratio upside-down, and it tends to follow interest rates:
 |
| Graph #6: Showing the Similarity of Interest Rates and Interest Paid relative to GVA Finance |
Or idunno, you tell me.


No comments:
Post a Comment