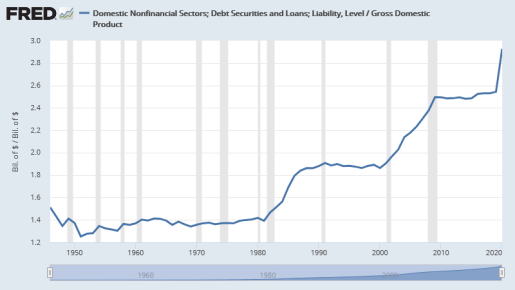
The data is FRED's TCMDODNS (domestic nonfinancial debt) at annual frequency and end-of-period aggregation. FRED's data runs from 1946 to 2020.
I looked at five-year periods. The first runs from 1946 to 1951 (six years, but only five changes in debt. That's why economists call the
first year T0, methinks: so that when they get to the sixth year it can be T5.) ... The first period runs from 1946-1951 and shows about a 26% increase in debt over 5 years. That data point marks the left end of the blue line, at 1951:
 |
| Graph #1: There is essentially no rapid debt growth after 1990! |
"Debt increase" increases from around 30% in 1958, to around 40% in 1970, to around 75% in 1979. That is a helluva lot of increase. And by the way, it is the increase of debt: We're talking about the increase of debt here, in the 1960s and 1970s -- a time, economists tell us, that debt was stable.
The high point (84% in 1986) includes the years 1981 to 1986 and, of course, includes President Reagan's "Morning in America". The sharp downtrend after 1986 is related to the Savings and Loan crisis, which occurred during that time.
The high point just before the Great Recession (2007: 55% increase in 5 years) would be the housing bubble I suppose.
But what I want you to notice is the years before 1980, and the seriously massive increase in debt. These are the years when Debt-to-GDP graphs show two decades or more of no increase. The flat spot on those graphs, and the long increase on Graph #1, both occur during the so-called "Great Inflation". Nominal GDP was going up like crazy because of that inflation. Debt was going up like crazy too, as Graph #1 shows (though not so much because of inflation). And the debt-to-GDP ratio ran flat flat flat:
 |
| Graph #2 |
Those years were great. We could afford our debt. We could afford our debt because inflation was driving income up just about as fast as debt was going up. Just about as fast. That is also the reason we don't see increase from the 1960s to 1980 on the second graph.
Don't let anybody tell you debt wasn't increasing in those years!
 |
| Graph #3: Debt-to-GDP was stable while Debt went through the roof, because of the Inflation. |
During the Great Inflation, nominal GDP increased as fast as debt. But that does not mean debt was "stable". It is also no coincidence that the so-called stability of Debt-to-GDP occurred during the Great Inflation. The "stability" was a result of the inflation!
Some time back I caught Scott Sumner talking about a household-debt-to-GDP graph. Sumner said:
What do you see? I suppose it’s in the eye of the beholder, but I see three big debt surges: 1952-64, 1984-91, and 2000-08.
Here's some of what I had to say about that:
Sumner sees one debt surge ending in 1964 and another beginning in 1984. Between those dates was the "Great Inflation". The inflation is the reason for what appears to be a flat spot on the graph. The inflation "eroded" debt.
The growth of debt continued apace.
I worked out compound annual growth rates for debt during Sumner's three "surge" periods:
- 1952-1964: 10.7%
- 1984-1991: 10.25%
- 2000-2008: 9.33%
and reported that:
During the famous flat spot of 1965-1983, the comparable rate of debt growth was 9.36%. That's near 90% of the growth rate for the 1952-1964 "debt surge" and it is higher than the growth rate for the third debt surge Sumner identifies.
There was no remission. Debt did not stop growing. It barely slowed.
Prices increased at a compound annual growth rate of 6.6% per year between 1965 and 1983, more than tripling during those years. There was no remission of debt. There was only erosion of debt because of the inflation.
If we think debt grew slowly before 1980 and fast after, it will influence the way policy is designed. If we design policy based on conditions that never existed, it means we don't understand our economy, and our policy will probably not work.
If we fail to understand what actually happened back in those years when the economy was good but then turned bad, we will not understand how to make the economy good again.
I guess we can always just get mad at the government. Kinda fun, isn't it, being "mad as hell". Just like the crazy guy in the movie.
Maybe they'll put that on our gravestone.


1 comment:
"But what I want you to notice is the years before 1980, and the seriously massive increase in debt."
I don't want you to focus on the highs. I want you to look at the increase that brought us to the highs.
If debt growth wasn't increasing, it would never have been so high.
Post a Comment