Monday, September 16, 2024

Three soft landings and one squandered opportunity

In a speech given March 21, 2022, a speech ironically titled Restoring Price Stability -- on a day when the Federal Funds effective rate was 0.33 percent, and a year after he warned us inflation was coming -- Fed Chair Jerome Powell said

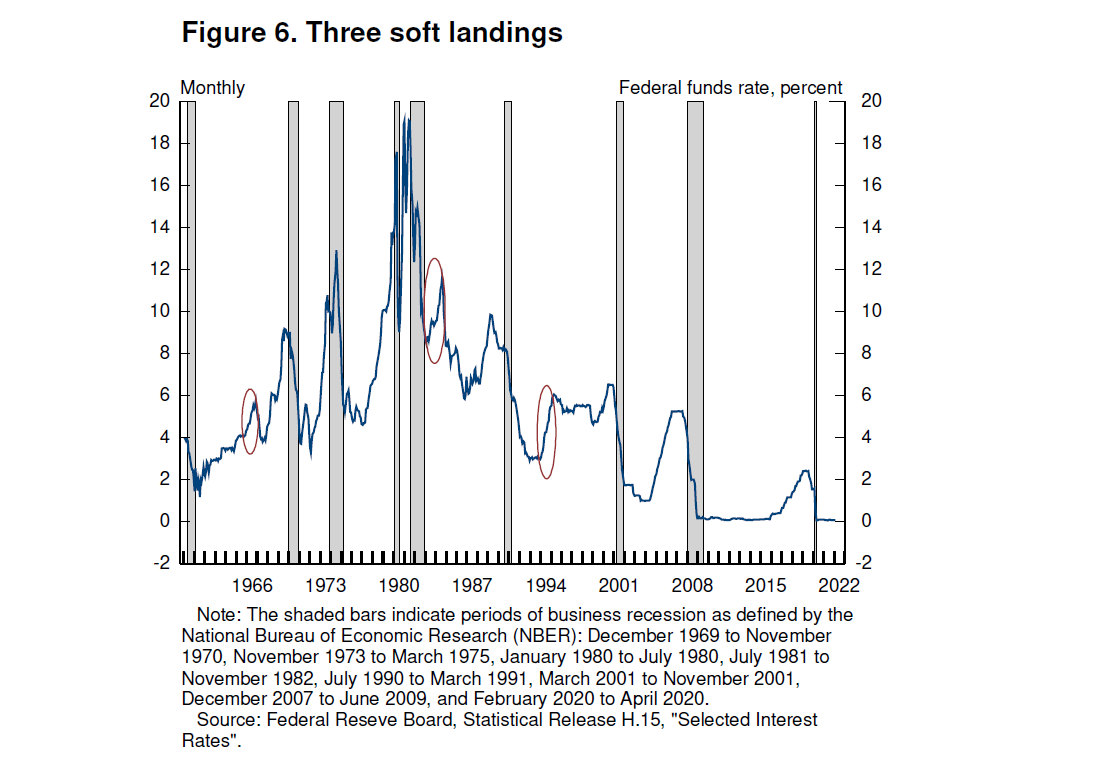
Some have argued that history stacks the odds against achieving a soft landing, and point to the 1994 episode as the only successful soft landing in the postwar period. I believe that the historical record provides some grounds for optimism: Soft, or at least soft-ish, landings have been relatively common in U.S. monetary history. In three episodes—in 1965, 1984, and 1994—the Fed raised the federal funds rate significantly in response to perceived overheating without precipitating a recession (figure 6).

Here is Powell's Figure 6:

Red ovals encircle three sharp increases in the interest rate—in 1965, 1984, and 1994. But I'm muttering to myself because Powell seems to think the interest rate shows soft landings.

My first graph below shows the interest rate that is managed by the Fed (blue), the annual rate of CPI inflation (black), and the unemployment rate (red). I show the red line a little heavier than the others, because in my view if you want a soft landing you need to watch the unemployment rate.


The Soft Landing of the mid-1960s


The graph shows January 1964 to December 1968 for https://fred.stlouisfed.org/graph/?g=1tLcA

The black line on the graph shows the rate of inflation. We don't like inflation.

The blue line (the interest rate) shows the Federal Reserve's response to inflation. The Fed increases the interest rate to fight inflation. Then, to encourage economic growth, as inflation comes down the Fed reduces the interest rate. This can be seen by noting the similarity of the black line and the blue through 1965, 1966, and 1967 on the graph.

The red line (unemployment) comes down after recession, as economic growth resumes. But over time, with growth comes inflation; with inflation comes interest-rate increase; and with interest-rate increase comes slowing growth and increasing unemployment again. You can see all these things on the graph above. 

During the recovery following the 1960-61 (not shown) recession, unemployment (red) came down, inflation (black) increased, and the Federal Reserve increased the interest rate (blue) to fight inflation.

The blue (interest rate) increase -- the increase from 4 percent to nearly 6 between November 1965 and November 1966 -- is the same as the first increase circled on Jerome Powell's graph.

During that year-long interest rate increase, the decline in the red line (unemployment) came to a sudden stop in February 1966. From September through November of 1966 unemployment fell a little more, but very little. Then in December 1966 and January 1967 the rate of unemployment went up -- a warning sign of approaching recession. All this behavior was a response to the rising interest rate.

Fortunately, the black line (inflation) peaked in October 1966, and fell for several months. This allowed the Federal Reserve to reduce the interest rate. That allowed economic growth to pick up. Improving growth stopped the increase of unemployment and prevented a recession.

Since the November-1965-to-November-1966 interest rate increase did not lead to a recession, Powell describes the result as a "soft landing".

In sum, the rapid response of the Federal Reserve, lowering interest rates immediately when the rate of inflation started falling, stopped the increase of unemployment and prevented a recession. The falling interest rate saved the day.


The Soft Landing of the mid-1980s


The graph shows January 1982 to December 1986 for https://fred.stlouisfed.org/graph/?g=1tLcA

The second interest rate increase circled on Powell's graph is shown here beginning soon after the 1982 recession (the gray background): The interest rate (blue) rises from 8½ percent to almost 12.

Inflation (black) peaks near 5 percent in March 1984. The interest rate peaks five months later, in August. In 1966, inflation peaked in October and the interest rate peaked the next month. That quick response, I said, stopped unemployment from rising before it turned into recession. We didn't get such a quick response in 1984.

Fortunately, we didn't need one. As in the 1960s, in the 1980s the rising interest rate did slow the decline of unemployment. And though that decline appears to have been paused from July of 1984 to July of 1985, the rate of unemployment did not increase, and recession did not result.

Unemployment trended downward from the end of the 1982 recession to the end of the graph (December 1986). Why? Perhaps because this was the time of "Morning in America" and 1984's 7.2 percent growth of Real GDP, after what was called the "double-dip recession" of 1980 and 1981-82. Or maybe it was simply because unemployment was so high that it couldn't go higher: You would have needed a pandemic to make it go higher. Anyway, unemployment came down despite the rate of interest, and we had no recession in the mid-80s. Jerome Powell calls this one another soft landing.


The Soft Landing of the mid-1990s


The graph shows January 1993 to June 1997 for https://fred.stlouisfed.org/graph/?g=1tLcA

The interest rate -- again, blue -- increased rapidly from December 1993 to April 1995. I don't see much impact on the rate of inflation. And the rate of unemployment trended downward, without slowing, from January 1993 to March of 1995. But then, suddenly, the unemployment rate jumped from 5.4 percent to 5.8. 

After that one jump, unemployment continued downward at a slower pace because interest rates were higher, but no longer rising. 

Probably, if the interest rate continued rising after April 1995, unemployment would have increased also. And recession would have been in the cards.


The Squandered Opportunity of 2024


The graph shows January 2021 to August 2024 for https://fred.stlouisfed.org/graph/?g=1tLcA

Now we come to the Biden inflation. 

The graph starts in January 2021, the month of Biden's inauguration. He was remarkably effective in getting that inflation started so quickly! Or I dunno, maybe he wasn't responsible for it, at all.

Anyway, in the 1960s, the interest rate peaked and fell with inflation. The falling interest rate kept unemployment from rising, and prevented a recession.

The 1980s and 1990s suggest that when the interest rate is already high, keeping it at a high level does little to push high unemployment up further. In the '90s, unemployment had to fall below 6 percent before high interest nudged it up.

A high rate of unemployment may not be pushed higher by rising interest rates. But a low rate of unemployment can be pushed higher by rising rates. In this post-pandemic recovery, since mid-2021 unemployment has been low enough that high interest rates can drive unemployment up.

The interest rate started rising (belatedly) in March 2022. CPI Inflation started falling in June 2022, and stopped falling in June 2023. The interest rate continued rising until August 2023 and remains at the August 2023 level to this day. This is not like the 1960s, when the rate of interest came down in tandem with the rate of inflation. This is more like the 1980s and 1990s, when the interest rate remained high, as if it was stuck. But our unemployment rate is low, and it is vulnerable to interest rates that are stuck at a high level. So the chances are not good that we will avoid a recession.

Sure enough, if you look for it on the graph, you can see that unemployment has been rising since early 2023. And only now, in the last couple weeks maybe, has there been any evidence of concern that we are in the process of creating a recession, with interest rates stuck at a high level to fight an inflation that has been running at about 3 percent since June of 2023.


Thursday, September 12, 2024

The Heritage Foundation is a charity

From the Heritage Foundation's About page:

The Heritage Foundation’s focus isn’t on putting more power into the hands of government—it’s on returning power to the people. That’s why we don’t work on behalf of any special interest or political party. Instead, our commitment is to the American people...

And in the Heritage Foundation's two-year-old (undated) "What This Election Day Means for Conservatives", in an interview with Michelle Cordero of the Heritage Foundation, Heritage Foundation president Kevin Roberts describes himself as "leading a nonpartisan entity". Presumably, the nonpartisan entity to which Kevin Roberts refers is the Heritage Foundation. So the Heritage Foundation is at least presumably nonpartisan. Or they want us to think that it is. 

Wikipedia says

Heritage is a tax-exempt 501(c)(3) organization and BBB Wise-Giving Alliance-accredited charity...

A what?


According to the State Department,

The Heritage Foundation is a non-profit public policy research institute...

The BBB Wise-Giving Alliance lists the Heritage Foundation twice on their Alphabetical List of Charities. You can include or exclude the word the in "The Heritage Foundation" and you get the same charity organization either way: Here is the image, as the page may change in June 2025.

The BBB Wise-Giving Alliance says the Heritage Foundation "Did Not Disclose" information regarding the BBB's "20 voluntary standards on matters such as charity finances, appeals, and governance."

Their boilerplate text says the Heritage Foundation

either has not responded to written BBB requests for information or has declined to be evaluated in relation to BBB Standards for Charity Accountability. Charity participation in BBB review is voluntary. However, without the requested information, it is not possible to determine whether this charity adheres to all of the BBB Standards for Charity Accountability.

Evidently the Heritage Foundation doesn't care about the BBB standards for charity accountability.

Candid Learning says

Organizations that qualify as public charities under Internal Revenue Code 501(c)(3) are eligible for federal exemption from payment of corporate income tax. Once exempt from this tax, the nonprofit will usually be exempt from similar state and local taxes. If an organization has obtained 501(c)(3) tax exempt status, an individual's or company's charitable contributions to this entity are tax-deductible.

And at Heritage, the fine print on the "Donate to the Heritage Foundation" page says

"The Heritage Foundation is a 501(c)(3) charitable organization and charitable contributions are tax-deductible for income, gift and estate taxes."

and that their "sister" organization

Heritage Action for America is a section 501(c)(4) nonprofit organization under the Internal Revenue Code. As such, contributions to Heritage Action for America are not tax deductible as charitable contributions.


Rating the Heritage Foundation, Charity Navigator says

This charity's score is 99%, earning it a Four-Star rating. If this organization aligns with your passions and values, you can give with confidence.

I didn't click it, but the same page has a bright red button that says "Donate". Apparently, after assuring yourself that the Heritage Foundation is a "Four-Star Charity" you can donate without even leaving the page.

There's something fishy about that. It's like the page, really, was set up to get donations rather than to verify the trustworthiness of charity organizations. I didn't get that feeling from the BBB Wise site, by the way.

Under "How We Rate Charities" the Charity Navigator says

Two objectives drive our approach to rating charities: helping donors and celebrating the work of charities.

Back on the page where Charity Navigator gave Heritage Foundation the Four Star rating, under "Rating Information" they say

This overall score is calculated from multiple beacon scores, weighted as follows: 93% Accountability & Finance, 7% Culture & Community.

Not much weight on culture and community. I can guess that Heritage is very good at using rich donor's money, but not at all committed to respecting the way of life of the American people.

But hey, it's not all bad news. According to one link,

TikTokers are urging people to report the conservative think tank behind Project 2025 to the Internal Revenue Service for allegedly violating the rules of its tax-exempt status.


Sunday, September 8, 2024

Kamala and the Cost Tradeoff

If I read my notes correctly, Symone at MSNBC's The Weekend (1 Sept 2024, 9:30 AM±) said Kamala wants higher-paying jobs for more Americans.

Sounds good to me. We've been underpaid for decades. But K must consider and confront Republican criticism of her call for higher pay. The R will say INFLATION. You know they will. They will tie Harris to Biden. They will tie her to the so-called "Biden inflation". Trump is doing that already. The R will make harsh criticism. K will need a powerful rebuttal. 

The R view will be something like this: Labor cost is a big part of the cost of output. So an increase in wages can be expected to lead directly to an increase in the price of output. 

It's like a reflex. But there is more. In addition to labor costs, a business has "non-labor" costs. The non-labor costs consist largely of purchases from other businesses. Embedded in those costs is the cost of labor at those other businesses. Thus, business costs consist to a large extent of the sum of direct and indirect (embedded) labor costs. So the R have a very strong argument when they say K's focus on better wages will cause inflation. 

All else aside, wage increases that drive prices up are self-defeating.

Kamala needs an economic plan that can prevent the drubbing the R are more than willing to give. K also needs a way to raise wages without creating inflation. Here is my plan: To create higher-paying jobs, Kamala should take advantage of a cost tradeoff: The increasing cost of labor should be offset by reducing the cost of finance. 

Between 1949 and 1981, there was a cost tradeoff we have not yet recovered from. Corporate interest costs increased by about 6½ percent of corporate spending. During those same years, corporate compensation of employees decreased by almost 7 percent of corporate spending. This cost tradeoff was good for corporations, but not for their employees.

Employee Compensation and Interest Cost relative to Corporate Deductions

There was plenty of inflation in the 1948-1981 period, inflation that drove corporate spending up. So those numbers, the 6½ percent interest-cost increase and the 7 percent wage-cost decline, are much bigger (in dollars) than the numbers suggest.

To boost wages without causing inflation, K can engineer a cost tradeoff where increased labor costs are offset by slower growth of finance, slower growth of debt, and slower growth of interest cost. Kamala can offset the rising cost of wages by reducing the scope and cost of finance.  


The amount of interest paid, barring complications, depends on the interest rate and the size of the debt on which interest is paid. Interest paid rises and falls with the rate of interest and the quantity of debt.

Corporate interest cost, the red line on the graph, rises along with interest rates and the quantity of debt from 1948 to 1981. Since 1981, however, interest rates have been generally falling while the quantity of debt has been generally rising. So the red line tends to run flat, with lows only at extreme lows in the interest rate: 5 years in the early 1990s, 5 years in the early 2000s, and most of the time since 2008.

My plan is, and Kamala's plan must be, to rejigger economic policy in every nook and cranny so as to turn incentives-to-be-in-debt into incentives-to-pay-down-debt. The tax deduction for interest paid, for example, is good for those who are in debt. So, that tax deduction makes debt higher than it would otherwise be. We must change that tax deduction. We must replace it with a tax deduction (or a tax credit) for making extra payments against loan principal. This will help people and businesses pay down debt. It will make debt lower than it would otherwise be.

The objective is to bring debt down for people and for businesses.

By relying less on credit and more on income, businesses will reduce their financial costs. They will be able to use the freed-up funds to increase wages without increasing overall business costs, without squeezing profit, and without the need to raise prices. The change in policy will make the red line on the graph come down, so corporations have more money available to spend on wage increases, and more money left over to boost their profit.

Consumers will see living standards improve as businesses increase wages without increasing prices. In addition, the new policy of increasing reliance on income (and reducing reliance on credit) will lead to less borrowing, less debt, and smaller debt service payments for consumers. With finance taking a smaller bite out of our disposable income, more income will be available to spend and to save -- and this is in addition to our higher income arising from the business interest-cost savings.

As we come to rely less on credit and more on income, the quantity of money will have to rise. But as long as money grows at a replacement rate (as credit-use falls), inflation should be comparable to what it was for many years before the so-called Biden inflation: generally acceptable. And because income comes to us without the cost of interest, inflation should be lower than what we had for those many years before the Biden inflation. Or economic growth higher. Or both.

Kamala's new policy will augment labor share, increase aggregate demand, and boost economic growth. It will also help reduce private-sector debt, which is the necessary precondition for reducing the federal debt.

Go Kamala!


The employee compensation data comes from BEA Table 1.13 row 4:
    Domestic Business: Corporate Business: Compensation of employees

The data on interest paid comes from BEA Table 7.11 row 3:
    Monetary interest paid: Domestic Business: Corporate business

The data for total deductions of active corporations comes from several sources.
Recent data from three sources:

Older data from multiple sources:

The most recent data on corporate deductions at IRS (as of 5 Sept 2024) is for 2020.

My Excel Spreadsheet: Corporate Cost Components (7 Sept 2024).xls at Google Drive

Sunday, September 1, 2024

Compound loss upon compound loss

You've heard of compound interest: You get interest on your money, plus you get interest on the interest. Gosh! Debtors are remarkably generous to creditors. What a lovely world this must be.

My topic here is compound loss: It works like compound interest, but in the other direction: Less instead of more, and less on top of less. It isn't about the money we get. It's about the money we don't get.


You've heard of "Potential GDP". Brookings defines it as

an estimate of the value of the output that the economy would have produced if labor and capital had been employed at their maximum sustainable rates—that is, rates that are consistent with steady growth and stable inflation.

Note, however, that "maximum sustainable" employment does not mean we all have to work 80 hours a week. I have seen people say "economic equilibrium" occurs when no one wants to change the existing conditions. No one wants more profit, for example, and no one wants to work less hours. That concept probably applies to Potential GDP.

Whatever. I just call it "best-case GDP". Here is the graph:

Graph #1: Potential GDP

It goes up. The graph shows a pretty smooth upward curve, except it goes up faster than usual in the latter 1990s.

Here's the same data, shown as "Percent Change from Year Ago" values:

Graph #2: High on the Left, Low on the Right: Potential GDP Growth is Slowing!

To my eye, two things stand out on this graph. One is that conehead-looking high spot in the latter 1990s. That's how the good years of the latter 1990s look, when you look at Potential GDP growth.

The other thing that stands out on this graph is the strong downhill trend. Except during the latter 1990s, it is all downhill from start to finish: From above 5 percent annual growth in the early 1950s, to above 4 percent in the 1960s, to 2 percent or less in recent (and future) years. Best-case GDP is not as good as it was 50, 60, 70 years ago.

You might think economists would spend their lives studying the latter 1990s to learn everything they could learn about those years, so as to duplicate that high-performance era and, well, avoid that wide gray recession bar and the lower-than-usual low that came a decade after the conehead high. That's pretty much what I do. Study the economy. Not economics, but the economy. This, my hobby. This, my life.


Here is a graph of Real GDP as a percent of Potential GDP:

Graph #3: It goes up and down, but the overall trend is down.
In other words, GDP is growing even more slowly than Potential GDP.

Real GDP is sometimes higher, sometimes lower than Potential. But the overall trend is down: As time goes by, Real GDP comes out to be less and less of Potential GDP. The growth of Potential, today, is half what it was in the 1960s, and Real GDP cannot even keep up with that. This is compound loss.

A linear trend line on this data in Excel shows Real GDP growth close to 1 percent faster than Potential GDP growth in the early years. In recent years, Real GDP growth is almost 2 percent slower than Potential. This relatively small loss means Real GDP growth has slowed 2.58 percent more than Potential GDP growth, which has fallen by 50 percent since the 1960s.

GDP is a measure of income. The slowing growth of Potential GDP is the slowing growth of best-case income. Best-case income growth today is half what it was in the 1960s. Real GDP growth cannot even keep up with that. And Real GDP growth is Real Income growth. 

As time goes by, we get less and less of the income we would have in a "best-case" world. The income growth in our less-than-perfect world decreases even faster than the income growth of our best-case world. This is compound loss.

And speaking of income, the next graph shows Compensation of Employees as a percent of GDP. Remember, Potential GDP growth is slowing, and GDP growth is slowing even faster. But on this graph, employee compensation has fallen rapidly as a share of GDP, for more than half a century:

Graph #4: Employee Compensation: Wages, Salaries, and Benefits as a Percent of GDP

From a high of 58 percent of GDP in 1970, it is all downhill to less than 52 percent today. Well there is the one big increase there, in the latter 1990s. But it did come back down right quick. 

We're getting paid 6 percent less of GDP now than we got in 1970. And GDP doesn't keep up with Potential GDP. And Potential GDP is growing at half the rate it was growing in the 1960s. We are dealing here with compound loss upon compound loss.