Thursday, August 29, 2024

FOMC Inflation Predictions, 2021 & 2022

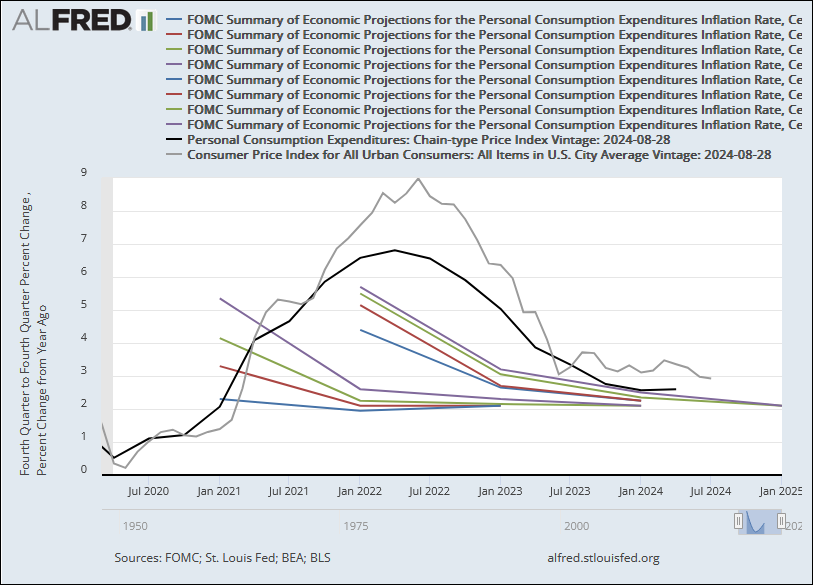
The gray line that reaches 9 percent inflation shows the CPI monthly since March 2020, the same month the Fed reduced the interest rate to zero to help fight covid. The black line that almost reaches 7 percent is the PCE Price Index (FRED series PCEPI) shown at quarterly frequency. The other 8 lines show inflation predictions made by the Federal Open Market Committee:

Graph #1: Click the image to see it bigger, or click "Graph #1" to see it at ALFRED

The four lines that start in 2021 show the four sets of predictions made by FOMC during 2021. I'm using the same color sequence that FRED uses:

  • Color 1: Blue: Here represents the March prediction set.
  • Color 2: Red: Here represents the June predictions.
  • Color 3: Green: Here represents the September predictions.
  • Color 4: Purple: Here represents the December predictions.

The four prediction sets made during 2022 use the same colors in the same sequence.

The Fed calls them projections, not predictions. The notes explain a lot:

Projections of personal consumption expenditures (PCE) inflation rate are fourth quarter growth rates, that is, percentage changes from the fourth quarter of the prior year to the fourth quarter of the indicated year. PCE inflation rate is the percentage rates of change in the price index for personal consumption expenditures (PCEPI).

The FRED Notes identify the FRED PCEPI dataset. So I went with that dataset for the black line on the  graph above, even though it is their monthly series. I changed the frequency to quarterly using average aggregation; of the available options, this made the best match to FRED's quarterly series PCECTPI.

I didn't quote the whole Notes text. You can see it in the flesh at FRED or ALFRED.

Each prediction set includes 3 or 4 data values, one for the year of reporting and the rest for the following years. You'll notice that no matter the value of the first prediction, in subsequent years the predictions typically move toward the Fed's 2 percent inflation target. I suppose "projection" is a better word for this than "prediction".

The CBO does something similar when it figures Potential GDP:

CBO assumes that any gap between actual GDP and potential GDP that remains at the end of the short-term (two-year) forecast will close during the following eight years.

That's from a 20-year-old CBO paper. It may be out of date. But the methodology for both CBO and the FOMC seems to be Fret not. Things will go according to plan.

And yes, that methodology works surprisingly well in a normal economy. But when the economy downshifts from 3 percent annual growth to 2 percent annual, and there is financial crisis, and people start talking about "the new normal", well, that's when better methodology is needed.


The transcript of Jerome Powell's 17 March 2021 press conference (where he repeated his inflation warning of 4 March 2021) has Powell saying:

The median inflation projection of FOMC participants is 2.4 percent this year and declines to 2 percent next year before moving back up by the end of 2023.

That sentence has been stuck in my head since I first read it. So I dropped what I was doing this morning when the series title "FOMC Summary of Economic Projections for the Personal Consumption Expenditures Inflation Rate, Central Tendency, Midpoint" turned up in FRED search results for federal spending. (Hey, I didn't put it there. I found it there!)

Looking for that Powell quote just now in the transcript, I found "FOMC" four times:

  • "Today the FOMC kept interest rates near zero..."
  • "... forecasts from FOMC participants for economic growth this year..."
  • "FOMC participants project the unemployment rate to continue to decline..."
  • "The median inflation projection of FOMC participants..."

The FOMC covers a lot of ground. 


So anyway: The last of the four 2021 projections -- December -- was for 5.35% PCE inflation in the fourth quarter of 2021. FRED's PCEPI data for the fourth quarter was 5.86%. The monthly PCEPI for December 2021 was 6.18%. The monthly CPI for December 2021 was 7.18%. And the Federal Funds interest rate was zero.

The first data value from each of the 8 FOMC projection datasets on the graph is shown in this table:

Year:2021 2022 
March:2.304.40
June:3.35.15
Sept:4.155.50
Dec:5.355.7

Note: In the table, the first data value in the March 2021 projection is given as 2.30 percent. Jerome Powell in the 17 March 2021 transcript gives the value as "2.4 percent this year". Maybe the difference is a typo. The FOMC projection Powell describes is the same March 2021 projection presented in the table.

Every projection in 2022 was higher than the corresponding projection in 2021. And in both years, the March projection is the lowest, and each subsequent projection is higher than the one before. The Federal Open Market Committee apparently did not think inflation would go down. 

It is their job to make inflation go down. But they did not think inflation would go down. This irritates me. They were right, of course: Inflation did not go down until they started raising the interest rate. But remember, it was in March 2021 that Chairman Powell warned of inflation, and it was a year later, in March 2022, that the Federal Open Market Committee finally started raising the interest rate.

The PCE measure started coming down after Q2 2022. And the CPI measure started coming down after June 2022. In both cases, inflation was coming down since midyear. And still the FOMC projections, even the September and December projections, were for rising inflation all thru 2022. I don't understand their thought process.

It almost looks like they wanted inflation raging.

Saturday, August 24, 2024

Human nature

When you have a drink, the first thing you lose is your resistance to having another drink.

The second thing you lose is your resistance to blogging about it.

Wednesday, August 21, 2024

The "base year"

I have a good feel for what a "base year" is. It is used a lot when "nominal" (actual-price) data is  converted to "real" (the-prices-never-change) data. For example, I use it when I divide the rising price level out of nominal GDP to get the "real" values -- values that exist because the economy actually grew, not because prices happened to go up. The "base year" is the year where the real GDP and the nominal GDP are the same. There is always one year like that for "real" data. If you look at a FRED graph of inflation-adjusted data (like Real GDP)  the vertical axis will be labeled something like "Billions of Chained 2017 Dollars". 2017 is the base year for that data. On a graph that shows both "real" and "nominal" GDP, the lines cross in the base year, because the values are equal in that year.

So I have a pretty good feel for the base year, but it comes from doing arithmetic. When I wanted a definition in words, I looked it up. The featured snippet comes from Investopedia, and it says "A base year is the first of a series of years in an economic or financial index."

The first of a series of years. I wish! If the base year was the first year for real GDP, the graph would show real GDP hanging low while inflation pushes nominal GDP up and up and up, like this:

Graph #1: The blue line is real GDP. The red line shows the result of inflation.

To make this graph, I took the shows both "real" and "nominal" GDP graph noted above, divided the real values by 1191.124 (the 1929 value of Real GDP in the FRED data), and multiplied the real values by 104.556 (the 1929 value of nominal GDP in the FRED data. Basically, I took the real data and scaled it down to make the first value -- the 1929 value -- equal to the nominal 1929 value.

Yes, I think the base year should, as a rule, always be the first year of the data on a graph. But that seldom happens. In fact, for Real GDP they move the base year frequently. At ALFRED they list the "units" used for the Real GDP in their archive:

  • Billions of 1987 Dollars
  • Billions of Chained 1992 Dollars
  • Billions of Chained 1996 Dollars
  • Billions of Chained 2000 Dollars
  • Billions of Chained 2005 Dollars
  • Billions of Chained 2009 Dollars
  • Billions of Chained 2012 Dollars
  • Billions of Chained 2017 Dollars

There is a move to a more recent base year every three to five years. Actual low prices become a more and more distant memory. This is how economists work. Standard practice, apparently.


The search that turned up the Investopedia definition also turned up one that I like better: this one, from  europa.eu:

In the calculation of an index the base year is the year with which the values from other years are compared. The index value of the base year is conventionally set to equal 100.

the year with which the values from other years are compared: yes.
the first of a series of years in an economic or financial index: no.

the base year is conventionally set to equal 100: yes
it is typically set to an arbitrary level of 100: no.

Oh, and both Investopedia and the europa (EuroStat) site think in terms of the price index having a base year. I think in terms of inflation-adjusted data having a base year. They are right. The data does have a base year, but it inherits the base year from the price index used to strip inflation out of the numbers. I can live with that.

Tuesday, August 20, 2024

Real GDP per Capita

Looked up Real GDP per Capita annual at FRED. Got 1225 search results.

Filtered for Geography Type: Nation and for Geographies: United States of America. Now, 7 search results.

Omitting the results that pertain to subsets

  • Real DPI per Capita
  • Metropolitan Portion
  • Consumption Share
  • Investment Share, and
  • Government Consumption Share

I am left with two datasets:

Constant GDP per capita for the United States and

Real GDP per Capita in the United States (DISCONTINUED) 

The one is in 2010 dollars and the other is in 2011 dollars, so I can't even compare them easily. And I hafta start by comparing them. So I put em on a graph.

The discontinued series ends in 2011, and both of them start in 1960. I was 11 years old in 1960. We should what, ignore those early years? WTF. 

So I looked up an old post of mine and read:

At FRED, this Real gross domestic product per capita page links to Table 7.1, which identifies FRED series B230RC0Q173SBEA as the relevant population measure for the per capita calculation. FRED calls that measure "Population". But when I search FRED for population, I get 107,803 results. So I call it "B23". I checked my arithmetic. Yes, that's the right population data for per capita GDP.

I took FRED's Real Gross Domestic Product series and divided it by the "B23" population measure, then corrected the units, and got my own version of Real GDP per Capita, with data that goes back to 1947. FRED offers 824,000 datasets from 114 different sources, and I have to make my own Per Capita GDP.

Maybe there's some detail I don't know about, a detail that explains why the data before 1960 is not valid. But I don't know about any such detail, so I'm good for now. I put my version on the graph with the others. Here's the graph:

Graph #1: Three Measures of GDP per Capita. Mine is the Green one.

Usually I make the lines thicker before I reduce the image size to fit the blog. Didn't do that this time because the green and red lines are so close together. To see the graph bigger click the image. Or click Graph #1 in the caption to see it at FRED.

Tuesday, August 13, 2024

The Covid Time


Graph #1: Household Borrowing (blue) and the CPI


Graph #2: Nonfinancial Corporate Business Profit (blue) and the CPI


Graph #3: Federal Spending (blue) and the CPI

Sunday, August 11, 2024

Excerpts: A "short" story

From Tom Cotton Admits Trump, Not Biden, Caused Inflation at Intelligencer, 2 December 2021:

Trump selected Powell in large part because he deemed his predecessor, Janet Yellen, too short to effectively handle monetary policy.

The part about Yellen links to The World’s Best Bureaucrat at Intelligencer, 27 October 2020:

Trump has the perspective of both a real-estate developer who likes to borrow money and a politician who knows low rates will juice the economy as he seeks reelection. So when he faced the choice about whom he should nominate to run the Fed, some of the names that might have been obvious choices for another Republican president — such as economist John Taylor and former Fed governor Kevin Warsh — were too out of step with Trump on monetary policy, because they were too likely to raise interest rates.

The president could have renominated Obama’s choice to run the Fed, Yellen, whose views on monetary policy are closer to Trump’s. There is precedent: Reagan, Clinton, and Obama all renominated Fed chairs who had originally been chosen by a predecessor of the rival party. But Yellen is a Democrat, and she was Obama’s pick, and Trump is notoriously suspicious of “Obama holdovers,” and also she is only five feet tall. I mention her height because in 2018, the Washington Post reported that Trump had repeatedly remarked to aides that Yellen seemed too short to run the central bank.

The part about the Washington Post links to Trump thought Yellen was too short to be Fed chair. That’s not how any of this works at The Washington Post, 3 December 2018:

Janet L. Yellen was the most qualified Federal Reserve chair we’ve ever had and maybe the most successful Federal Reserve chair we’ve ever had. But, in part because she was also the shortest Federal Reserve chair we’ve ever had, she wasn’t reappointed by President Trump.

That’s not a joke, or at least not a deliberate one. Trump, according to The Washington Post, seems to believe that the Fed is a lot like a roller coaster: You have to be so tall to go on it. In particular, he thought that the 5-foot-3-inch Yellen was too short to do the job that she’d been doing so well the previous four years. Which, along with wanting to make his own mark on the central bank, is why he broke with what had been a fairly long-standing bipartisan tradition of keeping on a Fed chair no matter which party had originally nominated them as long as they still wanted the job and seemed good at it.

Here, the part about the Washington Post links to Trump slams Fed chair, questions climate change and threatens to cancel Putin meeting in wide-ranging interview with The Post at The Washington Post, 27 November 2018:

Trump considered reappointing Yellen to the post, and she impressed him greatly during an interview, according to people briefed on their encounter. But advisers steered him away from renominating her, telling him that he should have his own person in the job.

The president also appeared hung up on Yellen’s height. He told aides on the National Economic Council on several occasions that the 5-foot-tall economist was not tall enough to lead the central bank, quizzing them on whether they agreed, current and former officials said.

Oh, yeah -- and this note, just below that last Washington Post article: 

Correction: An earlier version of this story misstated the height of former Federal Reserve Chair Janet L. Yellen. She is 5-foot-tall.

The End.