
The definition of the word "accumulation" provided by the Cambridge English Dictionary and returned by Google is
1. an amount of something that has been collected: 2. the process of gradually increasing in amount, or the increased amount...Either an amount of something, or the process of increasing. An amount, or a process.
When I talk about "the accumulation" of debt I definitely mean the huge amount of it. When I talk about "accumulation" of debt, sometimes I may mean the process.
What do Cecchetti, Mohanty and Zampolli mean when they say
The righthand panel of Graph 1 makes the rather stark point that real household debt tripled between 1995 and 2010, dwarfing the accumulation of debt in other sectors of the economy.... and is it okay to use the "D" word?
What do they mean? To my ear, they mean the amount. Not the process. "Real household debt tripled", they say. They're talking about the increased size of household debt, not the process of increasing. But of course, you can't have the one without the other.
Let me back up just a little, quote their whole paragraph, and show their graph:
Yeah, I think that's wrong. The size of household debt does not "dwarf" debt in other sectors of the economy. They make it sound like household debt is the biggest component. But household debt is the smallest of the components they are looking at, as the left-hand panel of their graph shows.As shown in Graph 1, from 1995 to the middle of the last decade, public debt had been relatively stable as a percentage of GDP. But this period of relative public sector restraint was accompanied by a rapid rise in household and non-financial corporate debt. The righthand panel of Graph 1 makes the rather stark point that real household debt tripled between 1995 and 2010, dwarfing the accumulation of debt in other sectors of the economy.
Graph #1

At the same time, the right-hand panel does show that household debt was the fastest-growing component of debt. So perhaps it is true that the "process" of accumulation of household debt dwarfs the others. It would be more clear, though, if they just said household debt grew the fastest.
The left-hand panel shows five measures of debt, in each case comparing the size of debt to the size of GDP. Since all the measures of debt are compared to the same standard, the left panel provides a good way to compare those debt measures to each other. The one that's biggest relative to GDP is biggest, period. The one that's smallest relative to GDP is smallest. From start to finish, except for two or three years between 2005 and 2009, household debt is the smallest.
The right-hand panel shows debt for the same five sectors. This time the debt numbers have been adjusted to remove inflation.
Here's something: When you want to see the growth of GDP, you take inflation out of the numbers. This lets you see the size of GDP so you can compare one year to another. Doing this, you are comparing GDP only to itself. Something similar is true for the right-hand panel: Forget the fact that there are several lines on the graph. Each line compares one measure of debt to itself. If the line goes up, the debt got bigger. This is what the right-hand panel shows.
If you put five lines like that together on a graph, it does NOT show that one pile of debt is bigger than another pile of debt. Each line compares one component of debt to itself.
The fact that the five measures all start with the same value allows us to compare the growth rates of the different debt measures. Because it is highest at the end, then, we have to say household debt was fastest-growing.
Household debt is the smallest but fastest-growing measure on Graph #1.
CM&Z's graph shows "total non-financial debt" and components of it. It shows that household debt is the smallest component, but the fastest growing.
Let's look at it.
And what does it leave out, their graph of non-financial debt and components? Well, obviously, it leaves out financial debt, the debt of financial business.
Let's look at that, too:
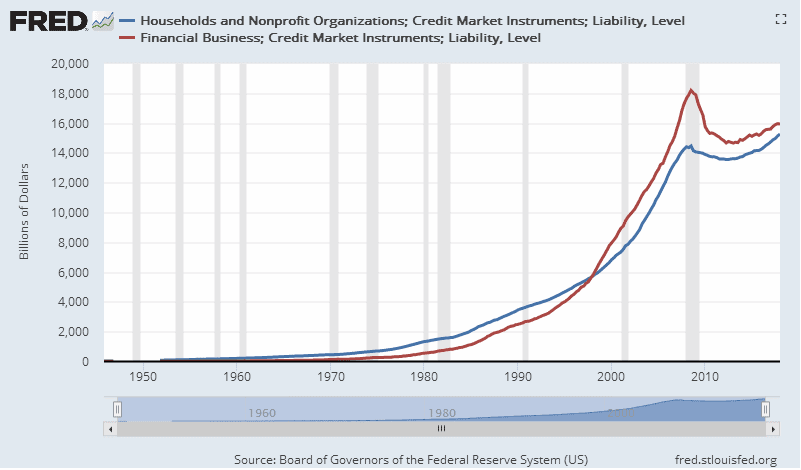 |
| Graph #2: Household Debt (blue) and Financial Debt (red). Data for the US only. |
And how do they compare for size?
 |
| Graph #3: Financial Debt as a Percent of Household Debt |
Household debt is the fastest growing component of non-financial debt. But Financial debt grew faster, from the 1950s to 2001. For half a century, financial debt grew faster than household debt.
Hey Cecchetti.
What?
Financial debt, it was growing even faster than household debt.
Yeah, so?
You wanna show it on our graph?
Nah.


No comments:
Post a Comment